
CIFAR-10是一个由 60000 张彩色图像组成的数据集。数据集分为 50000 张训练图像和 10000 张测试图像。每张图片大小为 32×32,与来自 10 个类别的标签相关联。每个类别有 6000 张图像。
| Label | claas name |
|---|---|
| 0 | 飞机 |
| 1个 | 汽车 |
| 2个 | 鸟 |
| 3个 | 猫 |
| 4个 | 鹿 |
| 5个 | 狗 |
| 6个 | 青蛙 |
| 7个 | 马 |
| 8个 | 船 |
| 9个 | 卡车 |
本教程提供了如何使用卷积神经网络 (CNN) 对 CIFAR-10 图像进行分类的示例。我们将使用 TensorFlow 2。
使用pip包管理器,tensorflow从命令行安装。
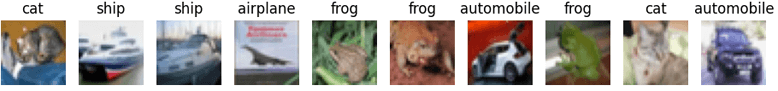
pip install tensorflowTensorFlow 2 提供了现成的 CIFAR-10 数据集,可以使用函数加载load_data。它下载数据集并将其缓存在文件系统上。为了验证数据集是否成功加载,我们将显示一些图像。
plot.py
from tensorflow import keras
import matplotlib.pyplot as plt

classNames = ['airplane', 'automobile', 'bird', 'cat', 'deer',
              'dog', 'frog', 'horse', 'ship', 'truck']

cifar10 = keras.datasets.cifar10
(trainImages, trainLabels), (testImages, testLabels) = cifar10.load_data()

fig, ax = plt.subplots(1, 10)
for i in range(0, 10):
    ax[i].axis('off')
    ax[i].set_title(classNames[testLabels[i][0]])
    ax[i].imshow(testImages[i])

plt.show()
我们显示前 10 个测试图像。

该load_data函数返回带有相关标签的训练和测试图像集。我们通过将每个像素值除以 255 以获得 0 到 1 的范围来对每个集合应用归一化。它提高了激活函数的性能。
Conv2D我们通过堆叠和层来构建卷积神经网络MaxPooling2D。输入的形状是[32, 32, 3]. 它对应于 [ image_height, image_width, color_channels]。CIFAR-10 有 10 个类别,所以最后一层有 10 个输出。
该模型是使用稀疏分类交叉熵损失函数和 Adam 优化器编译的。我们使用metrics参数来报告训练的准确性。
我们使用 10 个 epoch 来训练模型。该validation_data参数定义了将用于评估每个时期结束时的损失和准确性的数据。该模型不会根据此数据进行训练。我们没有单独的验证集,所以我们使用测试集。
plot.py
from tensorflow import keras
from matplotlib import pyplot as plt

cifar10 = keras.datasets.cifar10
(trainImages, trainLabels), (testImages, testLabels) = cifar10.load_data()

trainImages = trainImages / 255
testImages = testImages / 255

model = keras.Sequential([
    keras.layers.Conv2D(32, (3, 3), activation='relu', input_shape=(32, 32, 3)),
    keras.layers.MaxPooling2D((2, 2)),
    keras.layers.Conv2D(128, (3, 3), activation='relu'),
    keras.layers.MaxPooling2D((2, 2)),
    keras.layers.Conv2D(64, (3, 3), activation='relu'),
    keras.layers.Flatten(),
    keras.layers.Dense(128, activation='relu'),
    keras.layers.Dense(10, activation='softmax')
])

model.compile(
    optimizer='adam',
    loss='sparse_categorical_crossentropy',
    metrics=['accuracy']
)

trainHistory = model.fit(
    trainImages,
    trainLabels,
    epochs=10,
    validation_data=(testImages, testLabels)
)

plt.plot(trainHistory.history['accuracy'])
plt.plot(trainHistory.history['val_accuracy'])
plt.ylabel('Accuracy')
plt.xlabel('Epoch')
plt.legend(['Training', 'Validation'])
plt.grid()
plt.show()

(loss, accuracy) = model.evaluate(testImages, testLabels)
print(loss)
print(accuracy)

model.save('model.h5')
我们显示培训历史。它显示了每个时期的训练集和验证集的准确性。
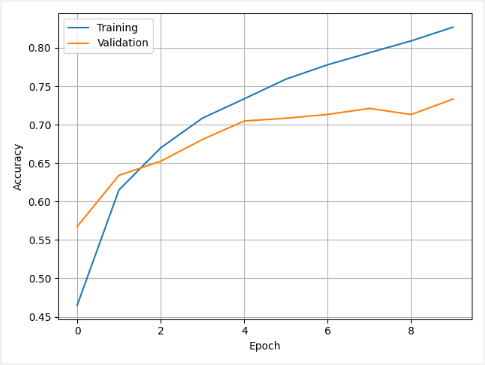
我们使用测试集评估模型。在这种情况下,我们得到的精度为 0.7333。这意味着模型准确率约为 73%。
0.852361798286438
0.733299970626831训练好的模型以格式保存HDF5。
训练了一个模型,现在我们可以预测给定图像的类别。
train.py
import tensorflow as tf
from tensorflow import keras
from matplotlib import pyplot as plt
classNames = ['airplane', 'automobile', 'bird', 'cat', 'deer',
'dog', 'frog', 'horse', 'ship', 'truck']
cifar10 = keras.datasets.cifar10
(trainImages, trainLabels), (testImages, testLabels) = cifar10.load_data()
testImages = testImages / 255
model = keras.models.load_model('model.h5')
classifications = model.predict(testImages[:10])
fig, ax = plt.subplots(1, 10)
for i in range(0, 10):
predictedLabel = tf.math.argmax(classifications[i])
ax[i].axis('off')
ax[i].set_title(classNames[predictedLabel])
ax[i].imshow(testImages[i])
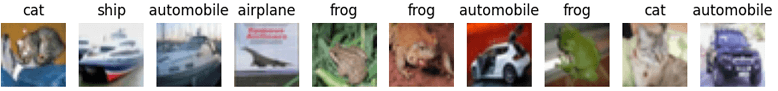
plt.show()我们预测前 10 个测试图像的类别。模型错误地预测了第三张图像的类别。
版权声明:本文内容转自互联网,本文观点仅代表作者本人。本站仅提供信息存储空间服务,所有权归原作者所有。如发现本站有涉嫌抄袭侵权/违法违规的内容, 请发送邮件至1393616908@qq.com 举报,一经查实,本站将立刻删除。