
在本文中,我们将使用 Python、OpenCV 和 matplotlib 进行图像分析。
我们的任务是探索包含两个不同大小的神秘圆圈的有趣图像,并深入研究量化和可视化它们之间差异的各种方法。
所以,事不宜迟,让我们从原始图像开始我们的冒险:
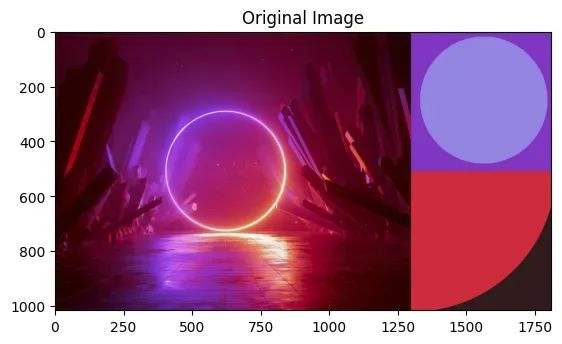

此图像是从 Microsoft PowerPoint 中提供的库存图像中精心挑选的。它迷人的设计激起了我的兴趣,并激励我使用一些对象检测魔法。现在我们已经熟悉了我们的起点,让我们开始这段旅程并逐步完成该过程的每个阶段!
第 1 步:加载图像并检测圆圈
我们的首要任务是加载图像并揭开隐藏在其中的圆圈。
为此,我们将寻求 OpenCV 库的帮助,它配备了一套全面的图像处理和计算机视觉任务工具。
import cv2
import numpy as np
import matplotlib.pyplot as plt

path_to_image = "/path/to/CircleImage.jpg"
image = cv2.imread(path_to_image)
gray = cv2.cvtColor(image, cv2.COLOR_BGR2GRAY)

min_dist = image.shape[1] // 2
circles = cv2.HoughCircles(gray, cv2.HOUGH_GRADIENT, 1.5, minDist=min_dist)

if circles is not None:
    circles = np.round(circles[0, :]).astype("int")
    for (x, y, r) in circles:
        cv2.circle(image, (x, y), r, (0, 255, 0), 4)

   # Show the output image
    plt.imshow(image)
    plt.title("Circles Identified!")
    plt.show()
else:
print("No circles found - Adjust Parameters")加载图像并将其转换为灰度后,我们应用cv2.HoughCircles函数来显示图像中的圆圈。这个函数利用了 Hough Circle Transform,这是一种旨在检测图像中的圆形形状的技术。
然后,我们在图像上绘制检测到的圆圈,并使用 matplotlib 揭开我们的杰作。
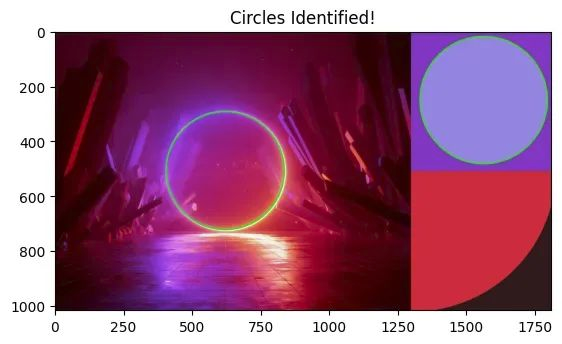
定位图像中的圆形对象
这时,我突然产生了一种强烈的好奇心:这两个圆圈的大小是否相同?
它让人想起了那些玩弄我们感知的视觉错觉图像。因此,我们的分析仍在继续!
第 2 步:创建蒙版并将其应用于图像
我们的下一个目标是隔离我们之前检测到的两个圆圈。我想知道如果我们在图像中将它们分开,是否会更容易辨别哪个圆更大。
为此,我们将制作一个仅包含两个最小圆圈的蒙版并将其应用于图像。
mask = np.zeros_like(gray)

for (x, y, r) in circles[:2]:
    cv2.circle(mask, (x, y), r, (255, 255, 255), -1)

masked_image = cv2.bitwise_and(image, image, mask=mask)

# Show the masked image
plt.imshow(masked_image)
plt.title("Masked Image")
plt.show()我们构造一个与原始图像形状相同的蒙版,然后在其上绘制两个最小的圆圈。然后使用函数cv2.bitwise_and将蒙版应用于图像,该函数仅保留两个圆圈内的像素,同时删除所有其他像素。
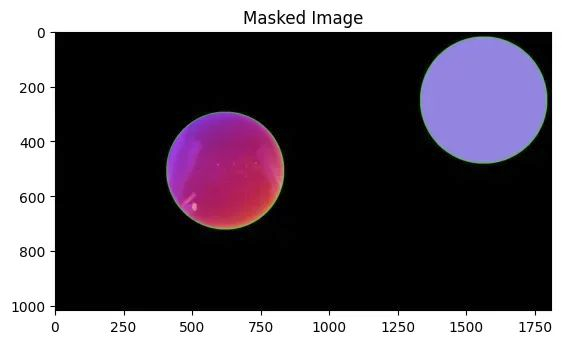
隔离两个圆圈的蒙版图像
由此产生的图像相当迷人。它唤起了地球(红色圆圈)和它的天体伙伴月球(紫色圆圈)的形象。或者,人们可能会将其视为iPhone游戏Osmos的第一关。
尽管如此,辨别这些圆圈的真实大小仍然很有挑战性。让我们使用连通分量分析来识别区域并计算两个圆的面积(以像素为单位)。
第 3 步:查找圆形区域并裁剪图像
为了更深入地研究两个圆圈之间的差异,我们将计算它们的面积并裁剪它们边界框周围的图像。
ret, labels = cv2.connectedComponents(mask)
regions = cv2.connectedComponentsWithStats(mask)

circle_areas = regions[2][1:3, cv2.CC_STAT_AREA]
print(f"Areas of the two circles: {circle_areas}")
这会在控制台上打印出圆圈的面积分别为169049和145189像素!
这远远超过我最初的怀疑。在某些图像分析中,例如计算机断层扫描,像素大小与实际尺寸相关,允许我们在需要时以实际单位计算面积。
接下来,让我们将两个圆圈并排放置,看看是否可以清楚地识别出较大的圆圈。我们将通过裁剪图像和填充较小的图像来实现这一点,以确保准确的比例比较。
# Crop the image to the bounding box of the circle with the largest area
largest_area = np.argmax(circle_areas)

# Get the bounding box of the largest area
x, y, w, h, area = regions[2][largest_area + 1]
print(f"Bounding box of the largest circle: {x, y, w, h}")

# Crop the image to the bounding box of the circle
large_area_cropped_image = masked_image[y:y + h, x:x + w]

# Crop the image to the bounding box of the circle with the smallest area
smallest_area = np.argmin(circle_areas)

# Get the bounding box of the smallest area
x, y, w, h, area = regions[2][smallest_area + 1]
print(f"Bounding box of the smallest circle: {x, y, w, h}")

# Crop the image to the bounding box of the circle
small_area_cropped_image = masked_image[y:y + h, x:x + w]

# Pad the smaller image to the same size as the larger image
large_height, large_width = large_area_cropped_image.shape[:2]
small_height, small_width = small_area_cropped_image.shape[:2]

# Calculate padding for each side
top_padding = (large_height - small_height) // 2
bottom_padding = large_height - small_height - top_padding
left_padding = (large_width - small_width) // 2
right_padding = large_width - small_width - left_padding

# Add padding to the smaller image
small_area_cropped_image_padded = cv2.copyMakeBorder(
    small_area_cropped_image,
    top_padding,
    bottom_padding,
    left_padding,
    right_padding,
    cv2.BORDER_CONSTANT,
    value=[0, 0, 0]
)

# Replot the images side by side
fig, ax = plt.subplots(1, 2, figsize=(10, 5))
ax[0].imshow(large_area_cropped_image)
ax[0].set_title("Largest Circle")
ax[1].imshow(small_area_cropped_image_padded)
ax[1].set_title("Smallest Circle")
# Give one title to the entire figure
fig.suptitle("Cropped Images Scaled")
plt.show()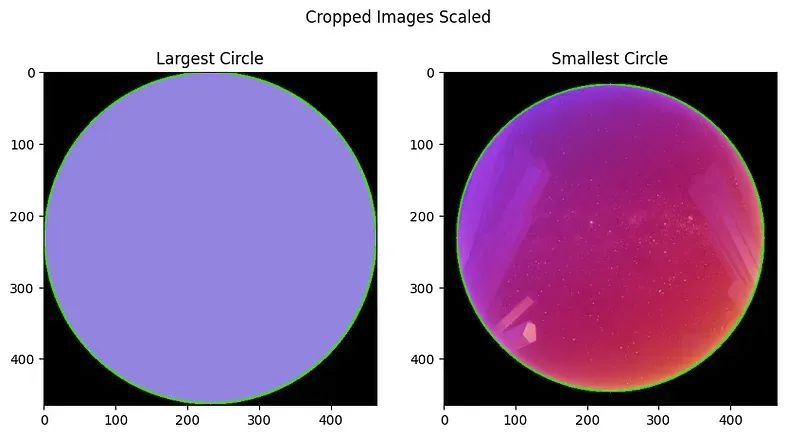
并排绘制缩放图像以比较区域
可视化图像现在清楚地表明红色圆圈比紫色圆圈小。
作为奖励,让我们尝试将较小图像的像素信息叠加到较大图像上——这是我以前从未尝试过的。我们将通过从较小的图像复制像素值及其相关位置并将该信息绘制到较大的圆圈中来实现这一点。
第 4 步:将较小的圆圈放在较大的圆圈内
我们将提取较小圆圈内的像素值和坐标,创建较大圆圈图像的副本,然后将较小圆圈绘制到较大圆圈的图像上。此外,让我们添加一些文本来强调这一点。
# Making a copy of the image to get the pixel values
image = small_area_cropped_image_padded.copy()

# Extract the pixel values and coordinates within the circle
circle_pixels = []
circle_coordinates = []

# Create a mask for non-black pixels
mask = np.any(image != [0, 0, 0], axis=-1)

# Get the coordinates of non-black pixels
circle_coordinates = np.argwhere(mask)

# Get the pixel values within the circle
circle_pixels = image[mask]

"""Within the large_area_cropped_image circle,
set all pixels within circle_coordinates to match circle pixels"""

# Making a copy of the image to draw on
image_copy = np.copy(large_area_cropped_image)

# Loop through the coordinates and pixel values
for (y, x), pixel in zip(circle_coordinates, circle_pixels):
    # Draw the pixel onto the image copy
    image_copy[y, x] = pixel

# Display the image
plt.imshow(image_copy)
plt.title("Proof: Smaller Circle in the Larger Circle")
plt.show()

# Calculate the percentage of size difference between the two circles
large_area = np.pi * (large_width / 2) ** 2
small_area = np.pi * (small_width / 2) ** 2
difference = (small_area) / large_area * 100

# Print the text "<difference>% of the size!" inside the circle
cv2.putText(
    image_copy,
    f"{difference:.1f}% of the size!",
    (large_width // 5, large_height // 2),
    cv2.FONT_HERSHEY_SIMPLEX,
    1,
    (255, 255, 255),
    2
)

# Display the image
plt.imshow(image_copy)
plt.title("Percentage of Size")
plt.show()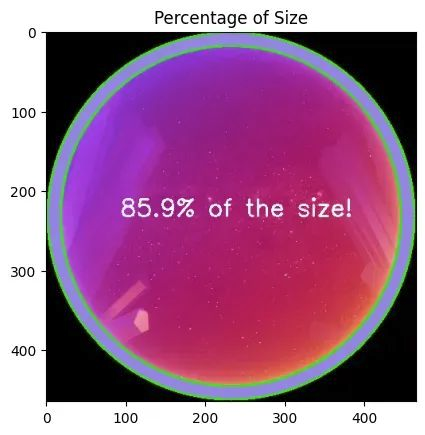
我们的最终图像分析
我们现在已经完成了这个任务。这个练习展示了图像分析的可能性,从感兴趣的随机图像开始。我们实现了对象检测、连通分量分析、面积计算,并磨练了我们在图像转换方面的技能。
作者:磐怼怼 | 来源:公众号——深度学习与计算机视觉【ID:uncle_pn】
版权声明:本文内容转自互联网,本文观点仅代表作者本人。本站仅提供信息存储空间服务,所有权归原作者所有。如发现本站有涉嫌抄袭侵权/违法违规的内容, 请发送邮件至1393616908@qq.com 举报,一经查实,本站将立刻删除。