


在 Android NDK 开发中,排查问题遇到的最熟悉的关键字非 backtrace 莫属,Linux 系统中进程 crash 后通过 backtrace 输出堆栈信息,开发者就是基于这些堆栈信息来定位代码问题。
当然定位 Native 层代码问题最优的方式还是通过 IDE(AS、VS)或者 GDB 进行 debug 断点调试,本文利用一个非常简单的 case 说明 Native 层定位 crash 的一般流程。
我们也可以借助于 ASAN (注意 Android 版本)进行定位,具体可以参考文章:用 Asan 提前解决 NDK 疑难 crash
写两行代码,先制造一个简单的 crash 场景。
SDK 头文件:
#ifndef NDKSAMPLE_ALGORITHM_H
#define NDKSAMPLE_ALGORITHM_H
#include<android/log.h>
#define LOGCATE(…) __android_log_print(ANDROID_LOG_ERROR,“ByteFlow”,__VA_ARGS__)
class Algorithm
{
public:
Algorithm();
~Algorithm();
int Init();
int UnInit();
int Process(const char* input, char* output);
};
#endif //NDKSAMPLE_ALGORITHM_H
SDK 实现:
#include <cstring>
#include “Algorithm.h”
Algorithm::Algorithm()
{
LOGCATE(“Algorithm::Algorithm()”);
}
Algorithm::~Algorithm()
{
LOGCATE(“Algorithm::~Algorithm()”);
}
int Algorithm::Init()
{
LOGCATE(“Algorithm::Init()”);
return 0;
}
int Algorithm::UnInit()
{
LOGCATE(“Algorithm::Init()”);
return 0;
}
int Algorithm::Process(const char *input, char *output)
{
LOGCATE(“Algorithm::Process()”);
// 简单拼接,没有检查指针
strcpy(output, input);
strcat(output, “Process Done.”);
return 0;
}
JNI 实现:
#include <jni.h>
#include <string>
#include “Algorithm.h”
extern “C”
JNIEXPORT jstring JNICALL
Java_com_byteflow_ndk_MainActivity_doProcess(JNIEnv *env, jobject instance, jstring input_)
{
const char *input = env->GetStringUTFChars(input_, 0);
LOGCATE(“MainActivity_doProcess input = %s”, input);
char output[1024];
//调用 SDK
Algorithm* pAlgorithm = new Algorithm();
pAlgorithm->Init();
//pAlgorithm->Process(input, output);
//传入空指针,制造 crash
pAlgorithm->Process(input, NULL);
pAlgorithm->UnInit();
delete pAlgorithm;
LOGCATE(“MainActivity_doProcess output = %s”, output);
env->ReleaseStringUTFChars(input_, input);
return env->NewStringUTF(output);
}
Java 层:
// Used to load the ‘native-lib’ library on application startup.
static {
System.loadLibrary(“native-lib”);
}
@Override
protected void onCreate(Bundle savedInstanceState) {
super.onCreate(savedInstanceState);
setContentView(R.layout.activity_main);
// Example of a call to a native method
TextView tv = (TextView) findViewById(R.id.sample_text);
tv.setText(doProcess(“Hello “));
}
public native String doProcess(String input);
1. 查找线程和进程 ID
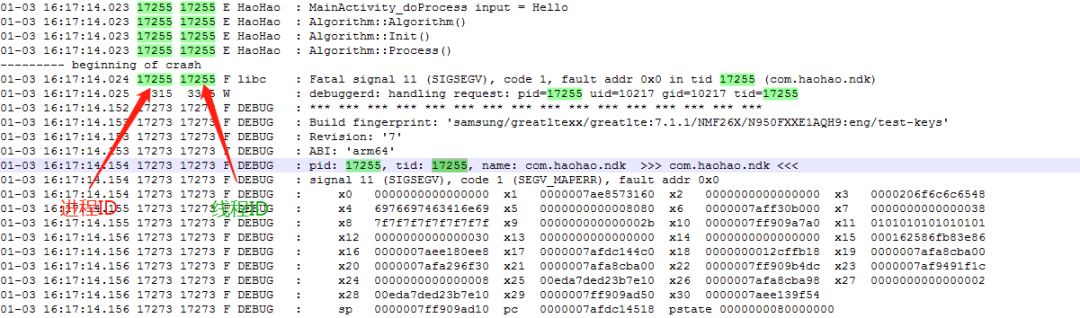
图中 pid 表示进程 ID ,tid 表示线程 ID 。在多线程场景中,这种方式非常有用,通过搜索 logcat 抓到的日志,能帮你快速定位在某个线程中代码执行到哪个位置出现了问题。
2. 用 addr2line 工具定位
addr2line 顾名思义,是内存地址转换成代码行号的工具。NDK 中自带 addr2line ,一般位于以下目录中:
//32bit
D:NDKandroid-ndk-r16toolchainsarm-linux-androideabi-4.9prebuiltwindows-x86_64binarm-linux-androideabi-addr2line.exe
//64bit
D:NDKandroid-ndk-r16toolchainsaarch64-linux-android-4.9prebuiltwindows-x86_64binaarch64-linux-android-addr2line.exe
执行 crash 代码得到的 crash log 。
01-03 16:17:14.023 17255 17255 E HaoHao : MainActivity_doProcess input = Hello
01-03 16:17:14.023 17255 17255 E HaoHao : Algorithm::Algorithm()
01-03 16:17:14.023 17255 17255 E HaoHao : Algorithm::Init()
01-03 16:17:14.023 17255 17255 E HaoHao : Algorithm::Process()
——— beginning of crash
01-03 16:17:14.024 17255 17255 F libc : Fatal signal 11 (SIGSEGV), code 1, fault addr 0x0 in tid 17255 (com.haohao.ndk)
01-03 16:17:14.025 3315 3315 W : debuggerd: handling request: pid=17255 uid=10217 gid=10217 tid=17255
01-03 16:17:14.152 17273 17273 F DEBUG : *** *** *** *** *** *** *** *** *** *** *** *** *** *** *** ***
01-03 16:17:14.153 17273 17273 F DEBUG : Build fingerprint: ‘samsung/greatltexx/greatlte:7.1.1/NMF26X/N950FXXE1AQH9:eng/test-keys’
01-03 16:17:14.153 17273 17273 F DEBUG : Revision: ‘7’
01-03 16:17:14.153 17273 17273 F DEBUG : ABI: ‘arm64’
01-03 16:17:14.154 17273 17273 F DEBUG : pid: 17255, tid: 17255, name: com.haohao.ndk >>> com.haohao.ndk <<<
01-03 16:17:14.154 17273 17273 F DEBUG : signal 11 (SIGSEGV), code 1 (SEGV_MAPERR), fault addr 0x0
01-03 16:17:14.154 17273 17273 F DEBUG : x0 0000000000000000 x1 0000007ae8573160 x2 0000000000000000 x3 0000206f6c6c6548
01-03 16:17:14.155 17273 17273 F DEBUG : x4 6976697463416e69 x5 0000000000008080 x6 0000007aff30b000 x7 0000000000000038
01-03 16:17:14.155 17273 17273 F DEBUG : x8 7f7f7f7f7f7f7f7f x9 000000000000002b x10 0000007ff909a7a0 x11 0101010101010101
01-03 16:17:14.156 17273 17273 F DEBUG : x12 0000000000000030 x13 0000000000000000 x14 0000000000000000 x15 000162586fb83e86
01-03 16:17:14.156 17273 17273 F DEBUG : x16 0000007aee180ee8 x17 0000007afdc144c0 x18 0000000012cffb18 x19 0000007afa8cba00
01-03 16:17:14.156 17273 17273 F DEBUG : x20 0000007afa296f30 x21 0000007afa8cba00 x22 0000007ff909b4dc x23 0000007af9491f1c
01-03 16:17:14.156 17273 17273 F DEBUG : x24 0000000000000008 x25 00eda7ded23b7e10 x26 0000007afa8cba98 x27 0000000000000002
01-03 16:17:14.156 17273 17273 F DEBUG : x28 00eda7ded23b7e10 x29 0000007ff909ad50 x30 0000007aee139f54
01-03 16:17:14.156 17273 17273 F DEBUG : sp 0000007ff909ad10 pc 0000007afdc14518 pstate 0000000080000000
01-03 16:17:14.158 3798 4376 D AllAroundSensingService: packageName : com.haohao.ndk className : com.haohao.ndk.MainActivity
01-03 16:17:14.158 3798 4376 V AllAroundSensingService: setPlatformBrightnessValue 120
01-03 16:17:14.165 17273 17273 F DEBUG :
01-03 16:17:14.165 17273 17273 F DEBUG : backtrace:
01-03 16:17:14.165 17273 17273 F DEBUG : #00 pc 000000000001b518 /system/lib64/libc.so (strcpy+88)
01-03 16:17:14.165 17273 17273 F DEBUG : #01 pc 0000000000009f50 /data/app/com.haohao.ndk-1/lib/arm64/libnative-lib.so (_ZN9Algorithm7ProcessEPKcPc+80)
01-03 16:17:14.165 17273 17273 F DEBUG : #02 pc 00000000000097d4 /data/app/com.haohao.ndk-1/lib/arm64/libnative-lib.so (Java_com_haohao_ndk_MainActivity_doProcess+180)
01-03 16:17:14.165 17273 17273 F DEBUG : #03 pc 0000000000286fec /data/app/com.haohao.ndk-1/oat/arm64/base.odex (offset 0x24a000)
从手机上抓导的 crash log 中首先列出来了 tid 17255 , fault addr 0x0告诉我们所有空指针引起的 crash ,然后寄存器 x0 存储的指针为空再次确认了是空指针引起的 crash 。
以上 backtrace 中,从 #00 到 #03 共 4 行信息表示 crash 时函数调用关系,调用关系为从下往上,即 #03 调用了 #02 的方法,以此类推, #00 行告诉我们是拷贝字符串时遇到了问题。
通过 _ZN9Algorithm7ProcessEPKcPc+80大致可以看出哪个函数出了问题,后面的 “80” 并不是指原始代码中的第 80 出现问题,实际上编译工具默认在编译过程中会进行优化和对齐。
addr2line 是通过 pc (程序计数器)值来定位代码,“-e” 后加 .so 文件名,“-f”表示输出函数名。实际上从 log 中可以看到 AndroidStudio 自动帮我们做了这件事。
根据 .so 是 32 位还是 64 位选择对应的 addr2line 工具,执行
aarch64-linux-android-addr2line.exe
-e <so 文件路径> -f <pc值>
D:NDK>D:NDKandroid-ndk-r16toolchainsaarch64-linux-android-4.9prebuiltwindows-x86_64binaarch64-linux-android-addr2line.exe -e libnative-lib.so -f 0000000000009f50
_ZN9Algorithm7ProcessEPKcPc
E:NDKWorkspaceNDKSampleappsrcmaincpp/Algorithm.cpp:34
通过 addr2line 我们定位出了Algorithm.cpp文件第 34 行出错,对应的函数名是
_ZN9Algorithm7ProcessEPKcPc ,
虽然根据这一串乱码大致可以看出哪个函数出了问题,但是为什么变成了一串乱码?
原来编译器在编译时对函数名按照一定的规则进行了优化,既然规则是一定的,那么当然也有人做出了还原方法,如
https://demangler.com 。
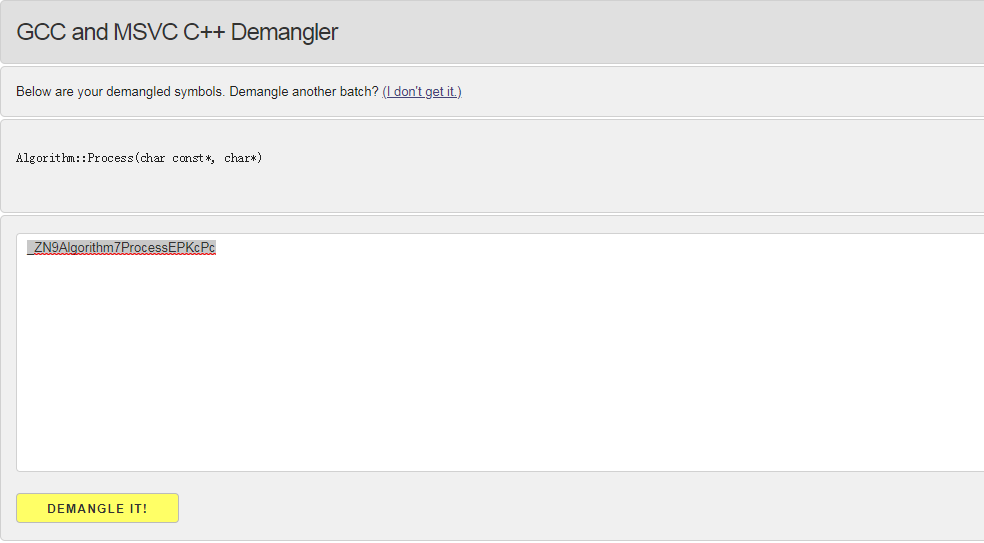
点击 DEMANGLE 便可以将乱码字符串还原成原始方法名。
另外在使用 addr2line 过程中经常会遇到 “??:?” 或 “??:0” 这种情况,原因就是一般 C/C++ 代码在编译配置中不生成符号表 symbolic 信息,不过 AndroidStudio 会默认为 so 文件添加符号表。
进技术交流群,扫码添加我的微信:Byte-Flow
本文来自作者投稿,版权归原作者所有。如需转载,请注明出处:https://www.nxrte.com/jishu/18048.html